Risk Exposure
Use the risk exposure histogram to view risk exposure. It is driven by the activity or summary that you select in the activity panel.
The histogram displays both a cumulative and non-cumulative chart showing the distribution of duration, cost, float, start, or finish dates for the selected activity.
Probability Values and Contingency
You can add probability values (P-values) to the chart by clicking in the chart in the desired location and selecting one of the Add/Remove P-value options. Each time you add a new P-value to the chart, Acumen Risk automatically adds the P-value data to the table beneath the histogram as a column to the main activity spreadsheet.
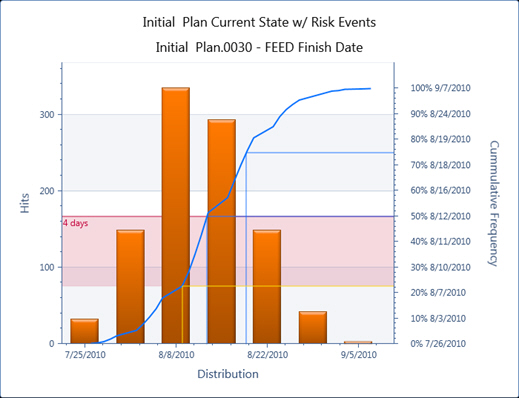
In addition, you can graphically plot contingency (the difference between a deterministic value and a P-value) by clicking in the chart in the desired location and selection one of the Add/Remove contingency options. Positive contingency is highlighted in red, negative contingency (that is, when your estimate has too much contingency built into it) is highlighted in green.
Example of a Risk Exposure Chart with Positive Contingency Highlighted